How to analyze your flipbooks’ statistics?
Publuu's statistics provide useful features for tracking how your flipbooks are performing, allowing you to analyze total views, page views, time spent, hotspot engagement, collected leads, PDF downloads, and more.
By analyzing this data, you can make smart decisions to optimize your flipbooks, improve reader engagement, and ensure your content fits your audience’s interests and needs.
In this guide, we'll show you how to access and understand your flipbook statistics.
🎥 Prefer watching instead of reading? Check out the video tutorial:
NOTE❕All statistics are only available to Optimum, Professional, and Premium plan subscribers. Basic plan users can view only total views. To access full statistics, upgrade your subscription on the Prices page.
Open the statistics panel
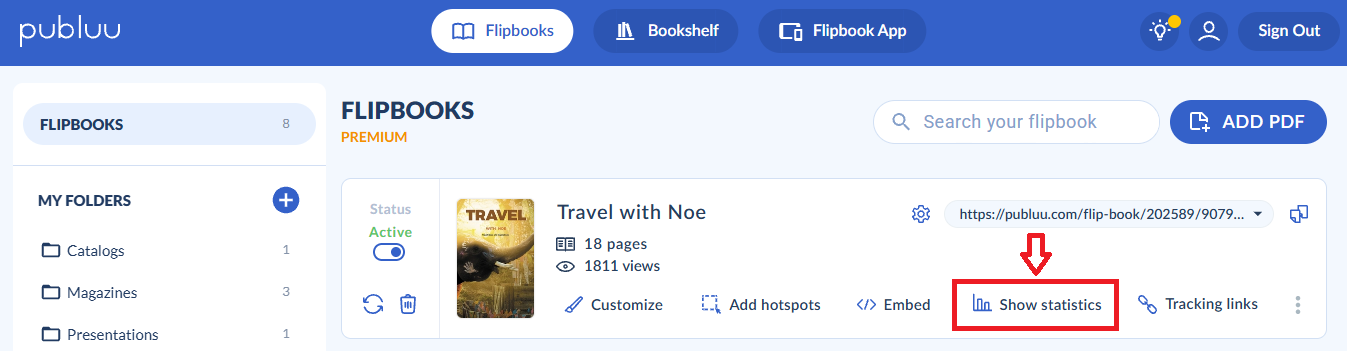
- Login to your Publuu account.
- Head over to any flipbook in your dashboard.
- Click the “Show statistics” button and you’ll enter the statistics panel.
Understanding flipbook statistics
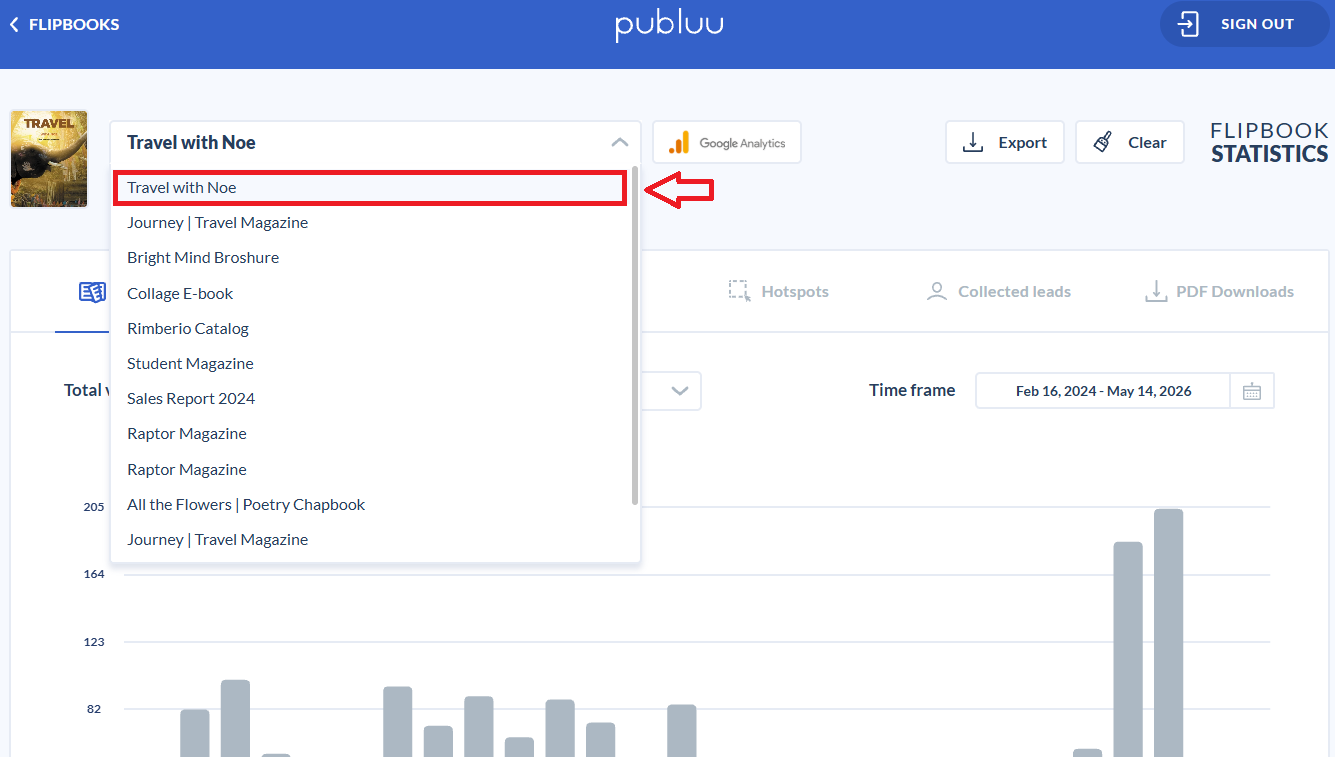
Once you are in statistic panel, your can select the flipbook you want to analyze:
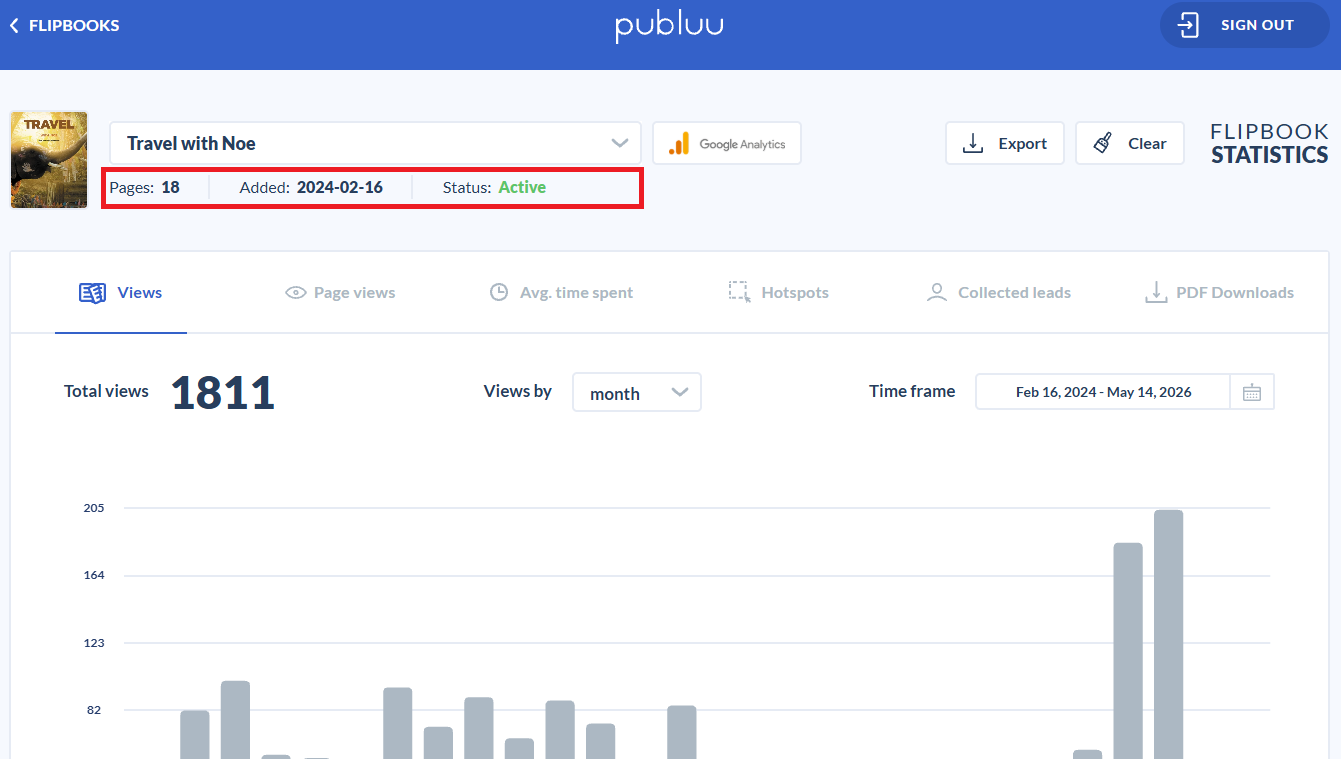
and see following information below:
- Pages - the number of pages
- Added - the creation date
- Status - availability status (Active or Disabled)
You can also export the flipbook's statistics to an Excel file with a single click for further analysis or sharing.
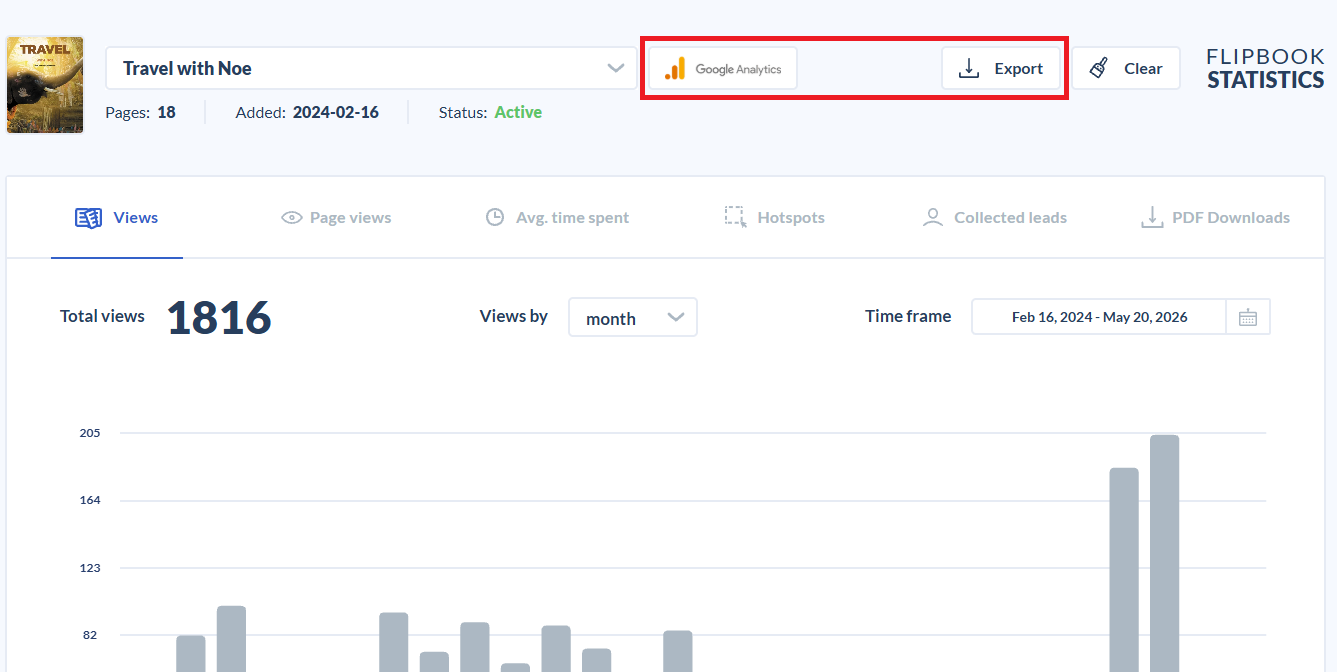
Additionally, you can integrate Google Analytics to get more detailed insights, such as user location or device usage, offering a deeper understanding of how your content is performing.
NOTE❕Google Analytics integration is available only for Professional plan subscribers.
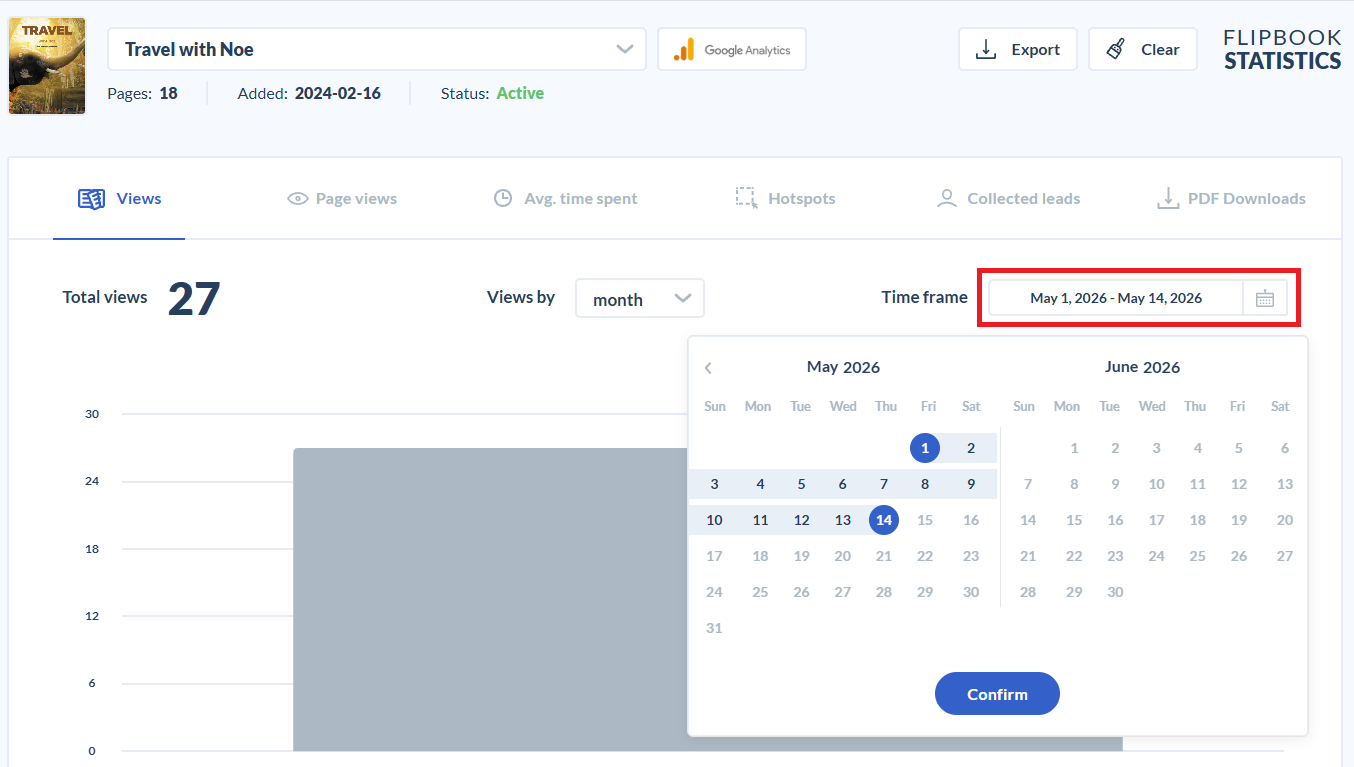
Specifying the time frame
Before analyzing your flipbook's statistics, set the time period. By default, the system suggests a time frame based on your flipbook's creation date, but you can choose a different date range.
To do so:
- Go to “Time frame” in the right corner.
- Click the date frame to open the calendar pop-up.
- Choose the first day for the start and the last day for the end of your analysis period
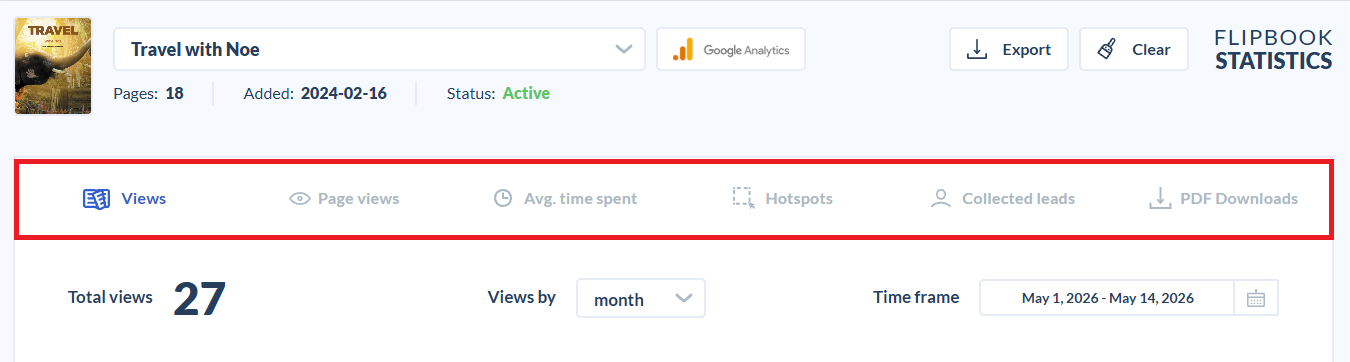
Statistics tabs
In the statistics panel, you can switch between the following tabs:
- Views – Total number of views your flipbook link was opened.
- Pages viewed – Number of individual pages accessed.
- Average time spent – Average amount of time visitors spend on the flipbook.
- Hotspots – Interactive elements that were clicked or engaged with.
- Collected leads – Number of leads collected via lead forms in the flipbook.
- PDF Downloads – Number of times the PDF was downloaded.
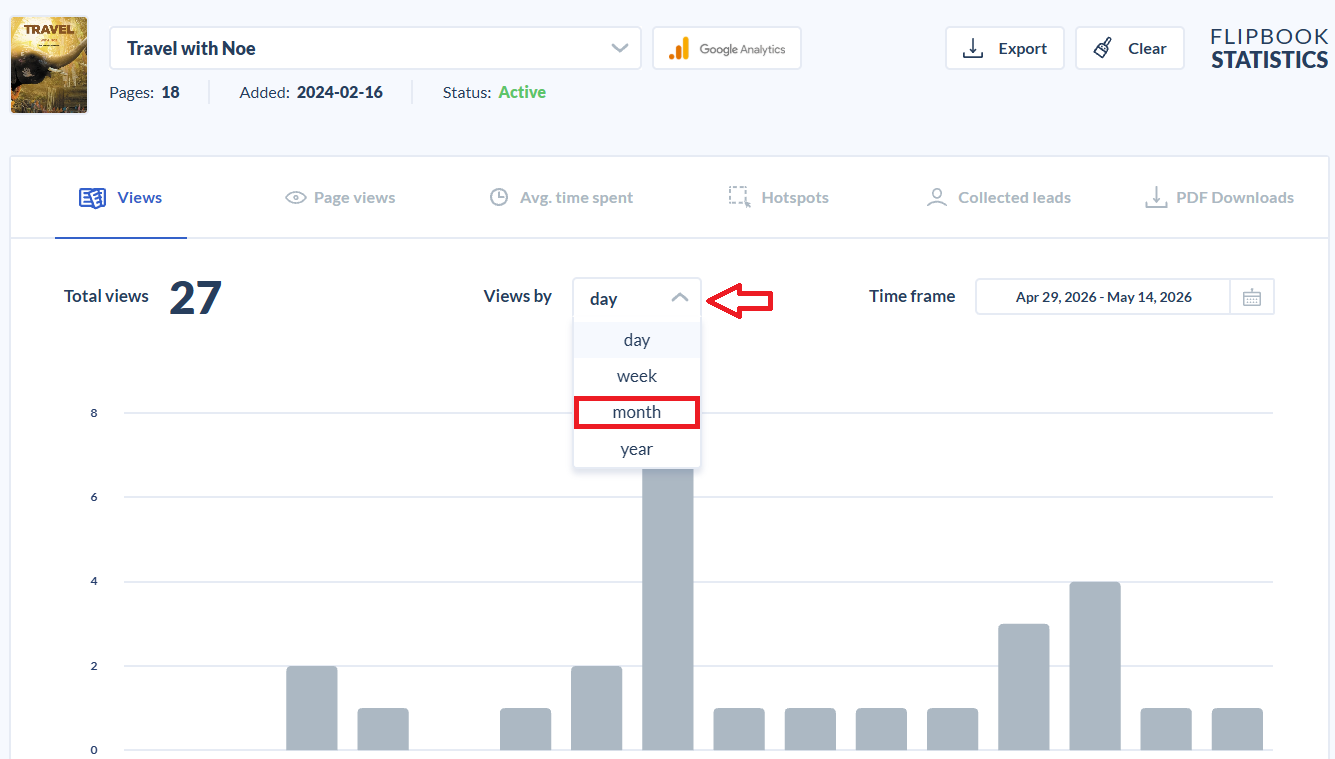
Views
In this tab, you can see the total number of views your flipbook link was opened. The data is shown with bar graphs, allowing you to easily check the statistics over a given period.
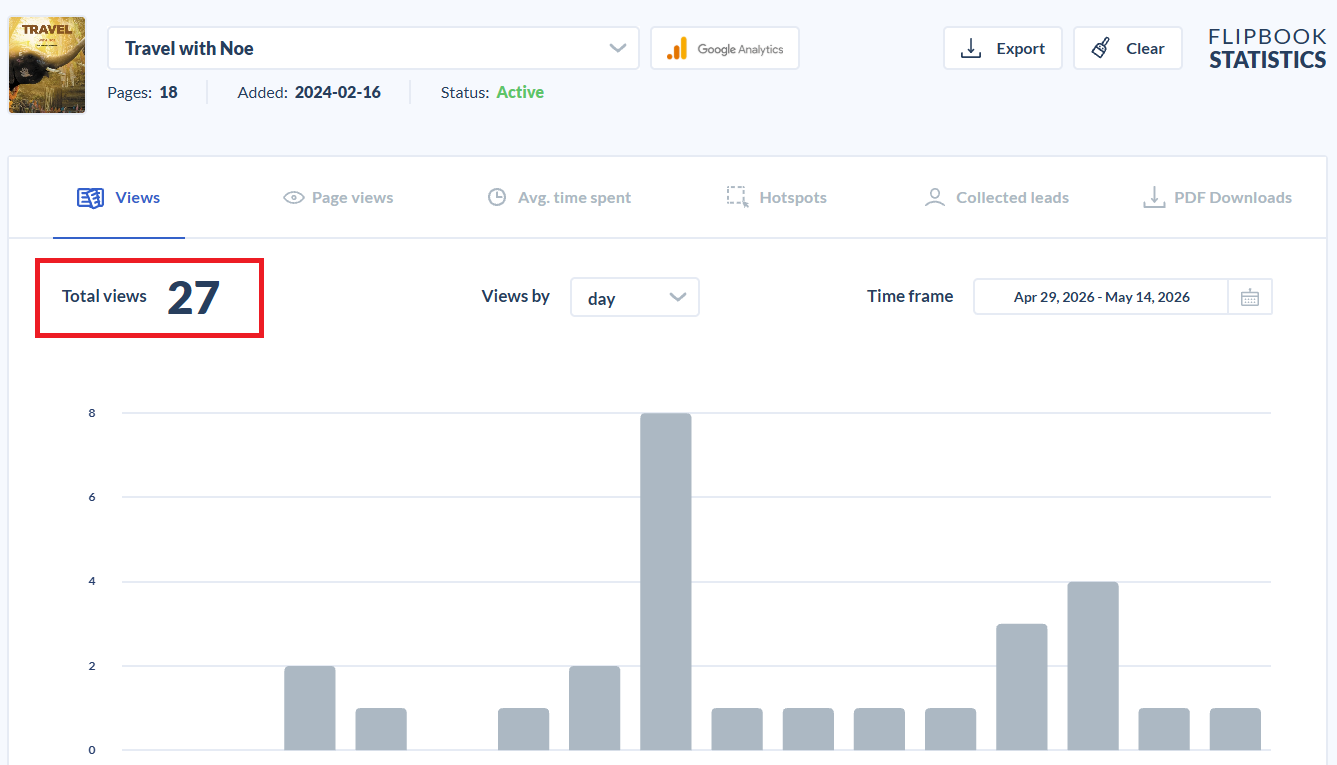
The system automatically suggests grouping based on when your flipbook was created. You can choose from the list to view by day, week, month, or year.
To see the exact number of views for a specific day, move your cursor over the bar graph to see a preview. For example, on February 2nd, 2024, a flipbook received 384 views.
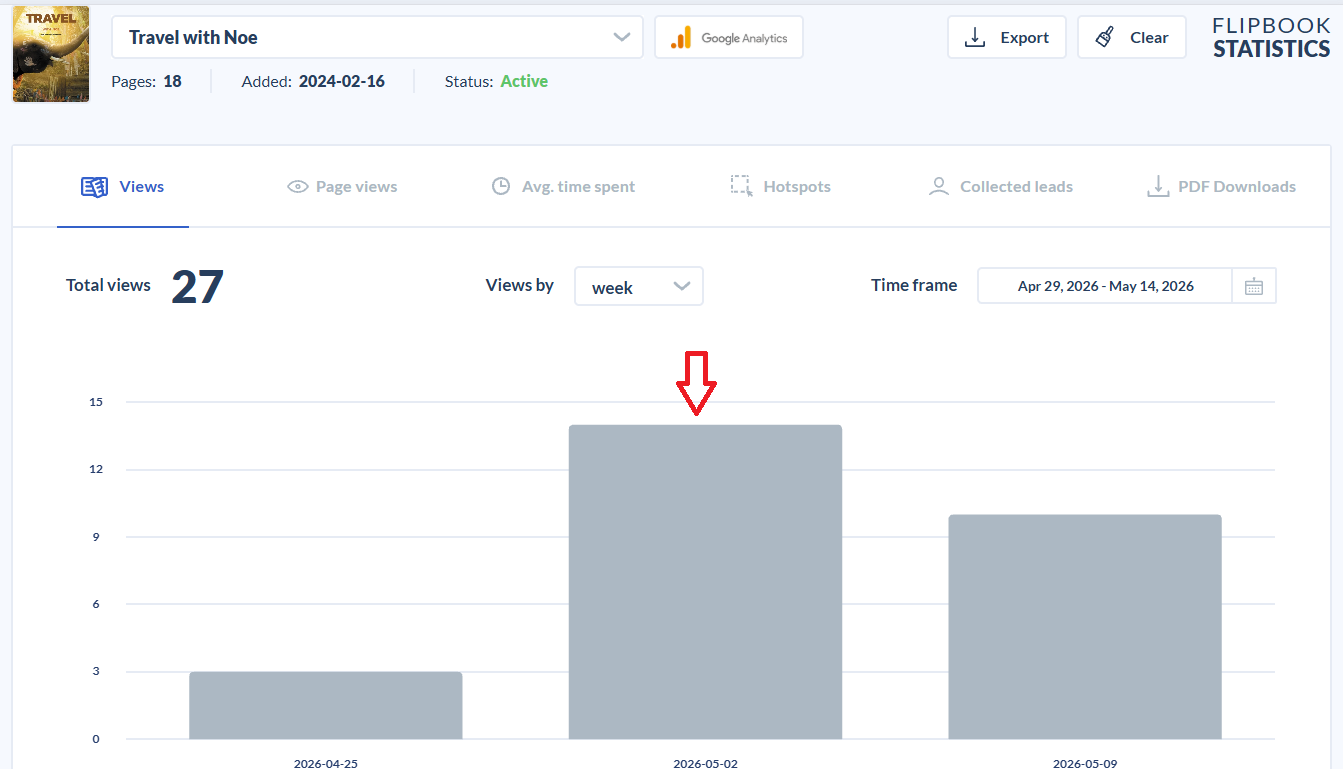
NOTE❕A single visitor can generate multiple views by opening the flipbook several times.
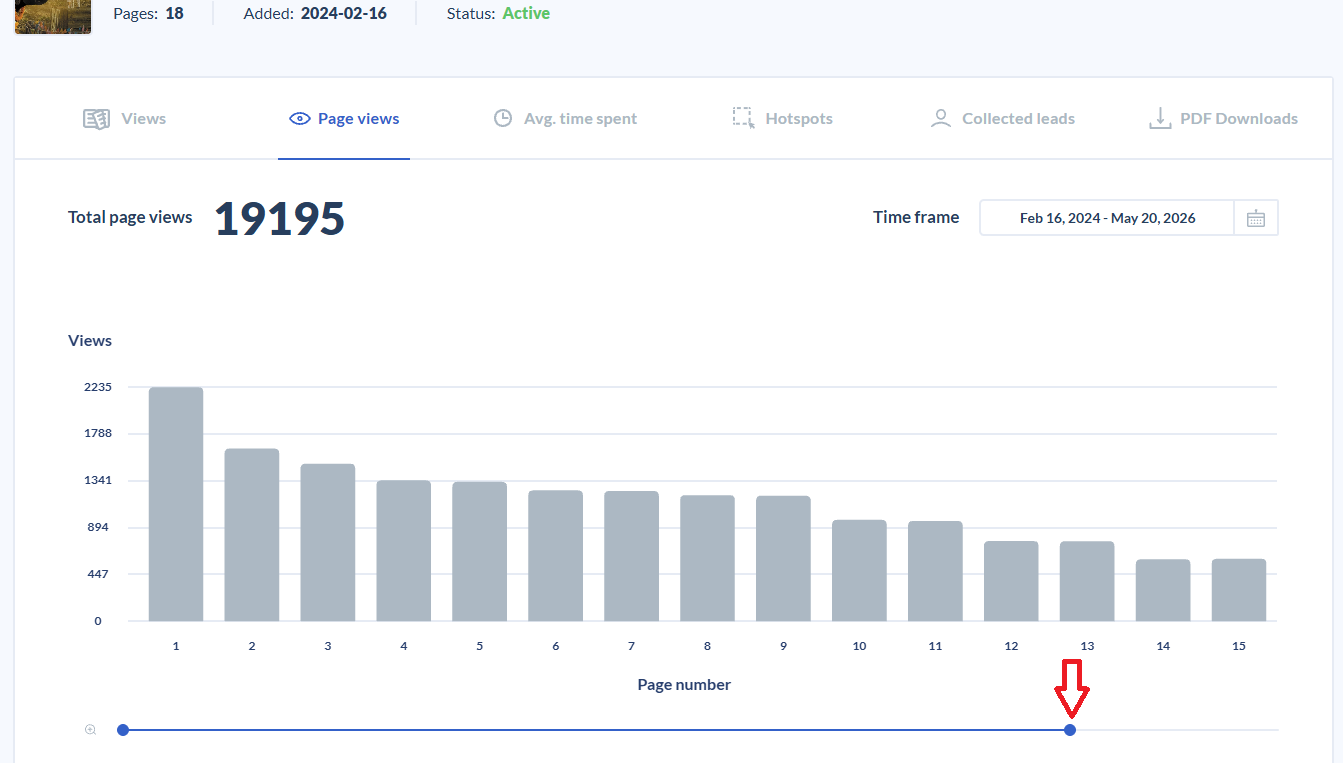
Page views
Let’s take a look at the Page views tab, where you can see the total number of page views. The bar graph shows the individual pages of your flipbook, with each page numbered at the bottom.
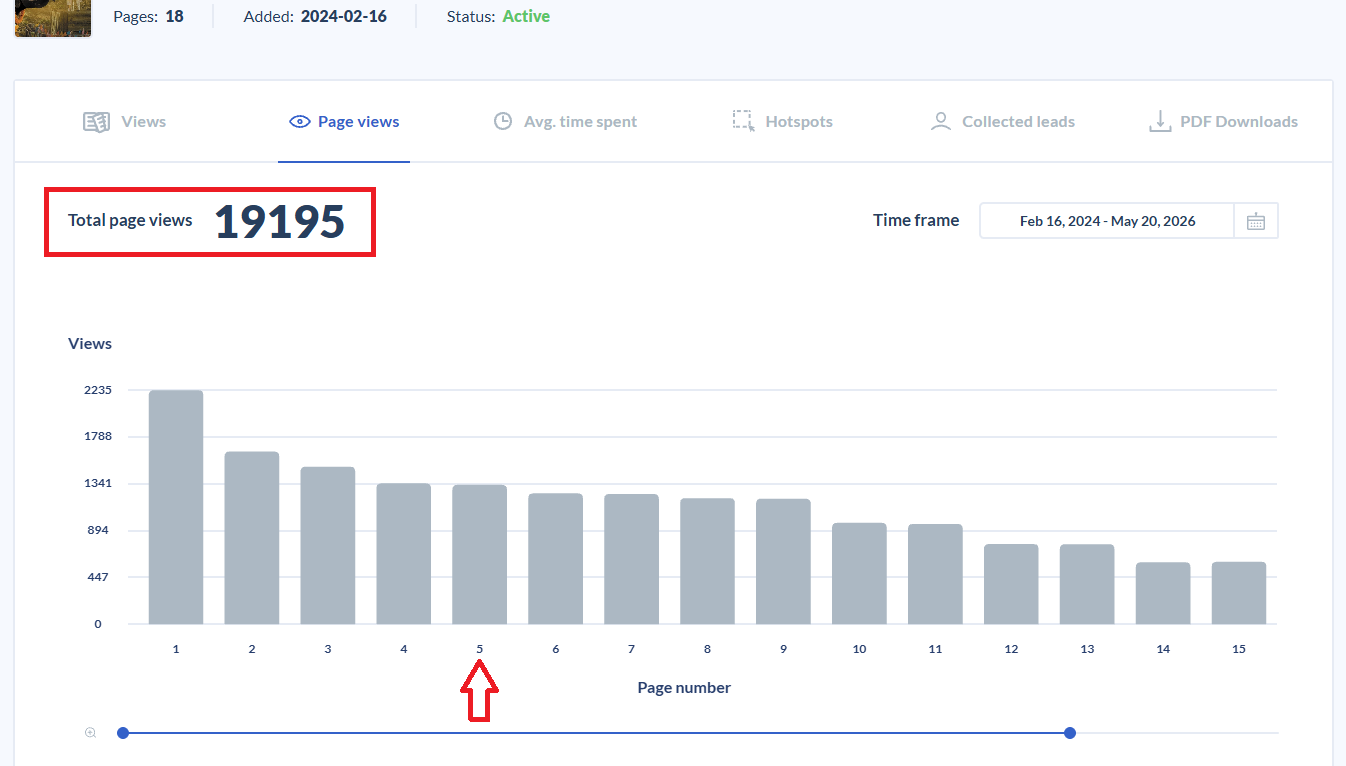
The higher the column, the more views a page has. Here, you can also hover over any bar to see a preview of the particular page and see the exact number of views it has.
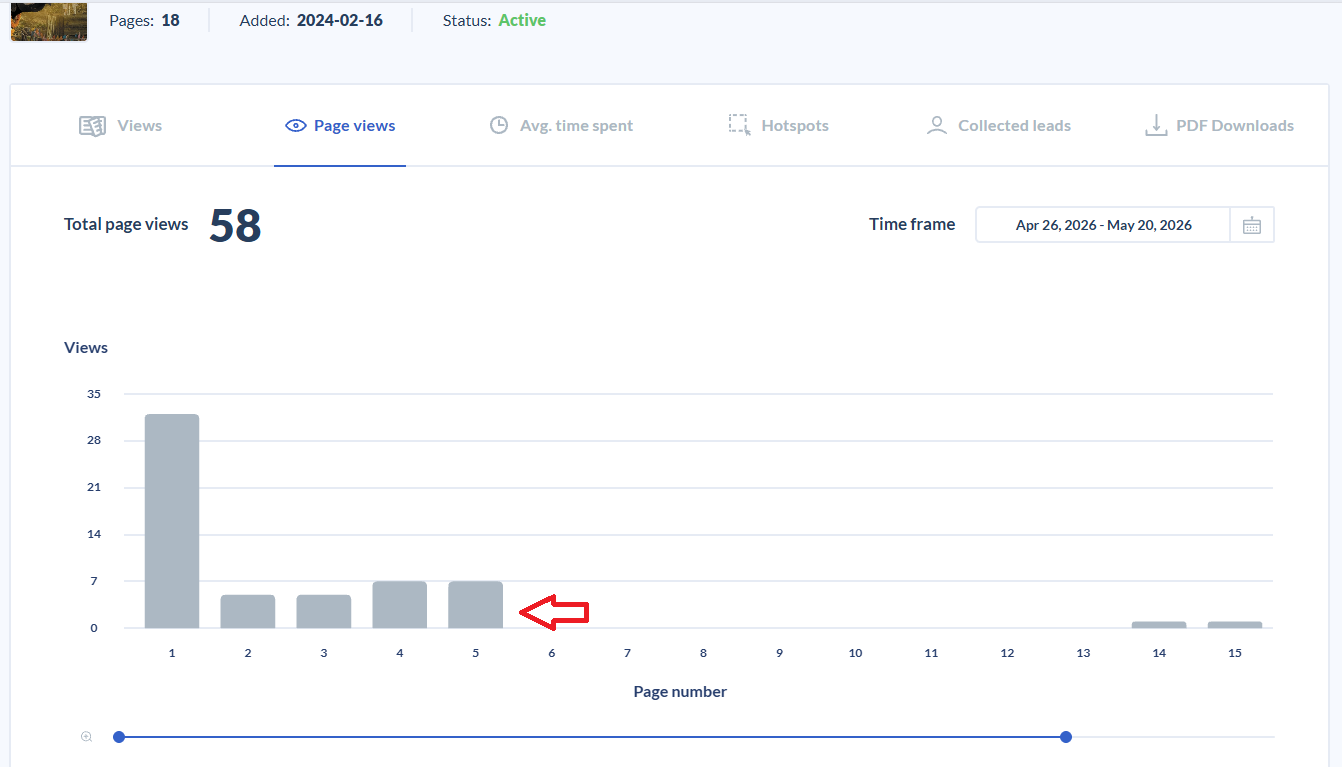
You can also use the slider to select a specific range of pages to be shown in the graph.
Notice that the first page usually gets the most views, with a gradual decrease afterward. This is common, especially if the flipbook is embedded on a website. Even if a reader doesn't go through the entire flipbook, the first page still counts as a view.
💡TIP: Some pages may get more views, showing they’re valuable to visitors. If many readers stop after the first page, it’s worth investigating why and considering adjustments to improve the content.
The Page views tab allows you to see which pages of your online publication are most popular with readers. This information helps you determine which content works best for your audience or which product gets the most attention.
NOTE❕If the user sets double-page mode, two pages are displayed at once when viewing a flipbook on a desktop. We can't determine which page they're focusing on, so we record the viewing time for both. For example, if a person spends 10 seconds on pages 4-5, both pages get 1 view and 10 seconds of viewing time.
Average time spent
After selecting this tab, you can view the average time readers spent on each page of the flipbook during the specified time frame.
Just like before, stats are shown using bar graphs. To see a preview of the page and the average time spent on it, hover your mouse over a specific column in the graph.
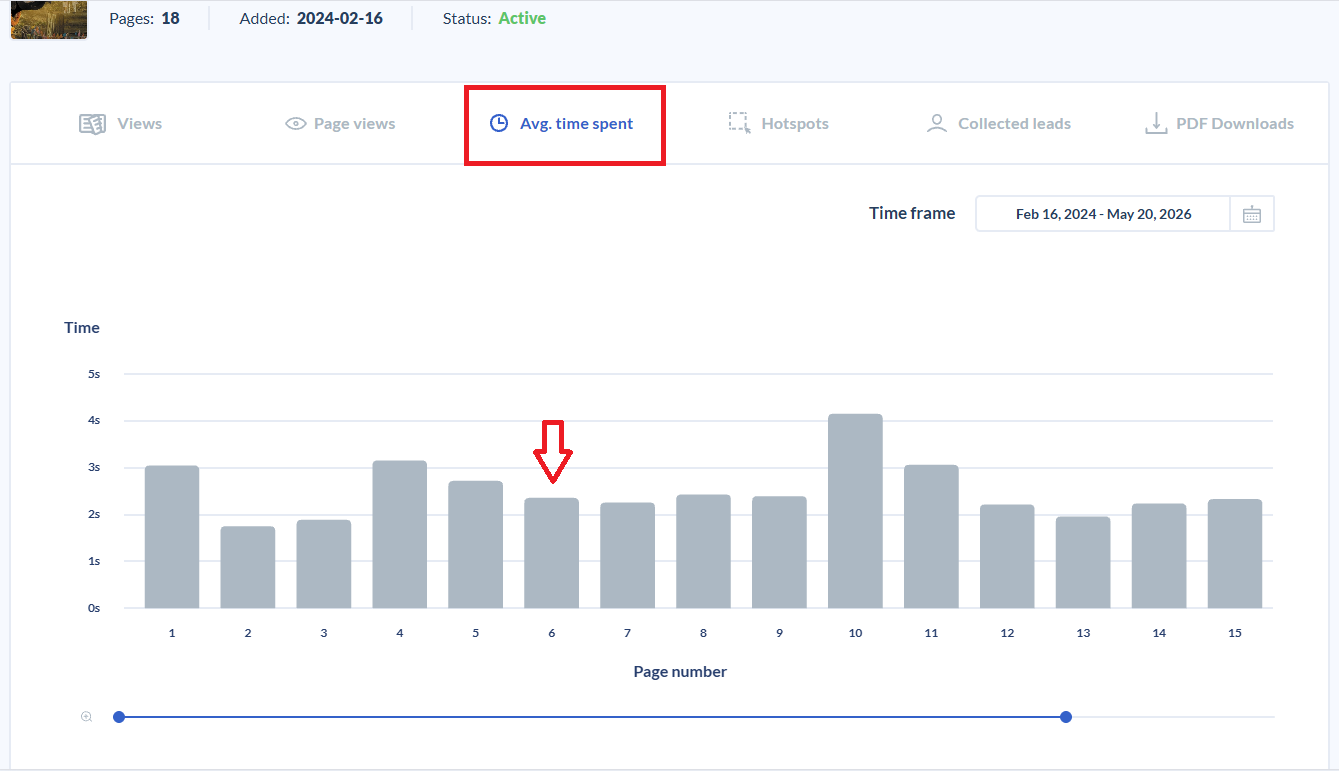
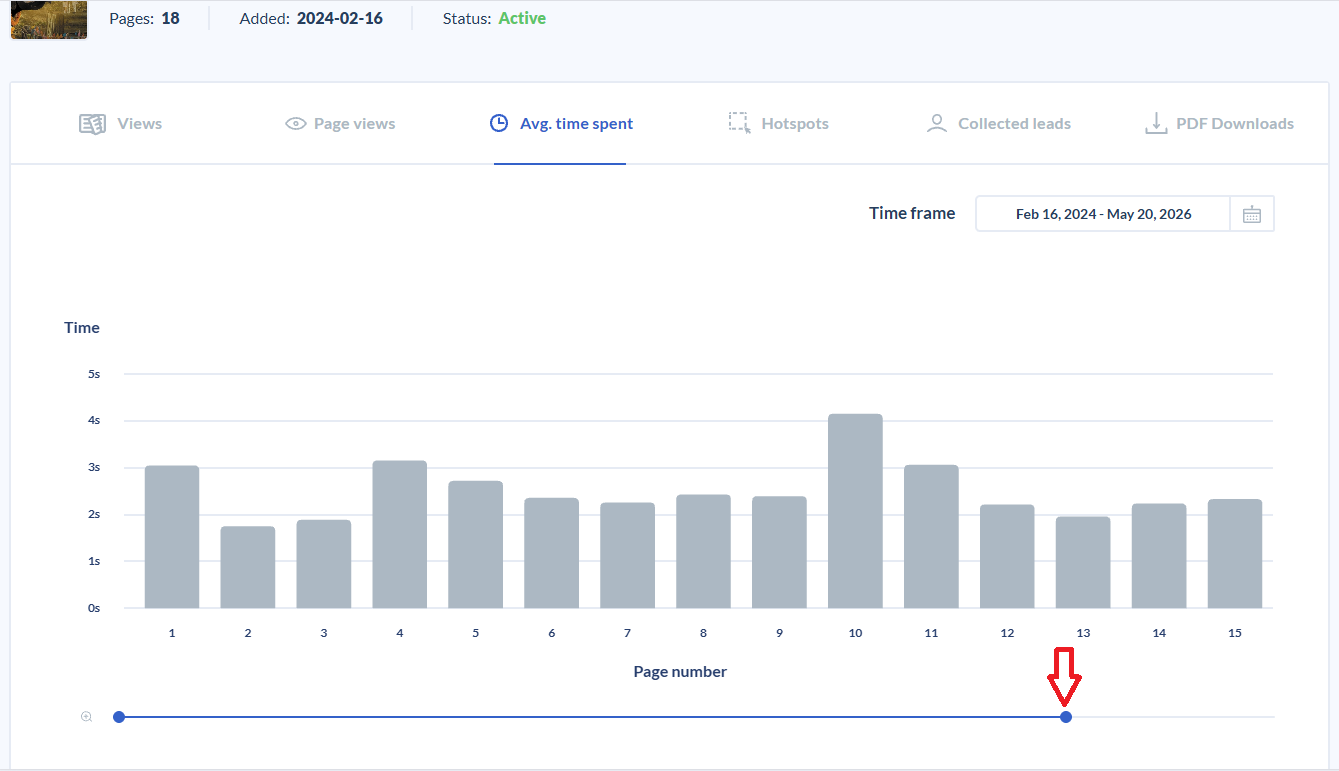
You can use the slider here as well to select a specific range of pages to be shown in the graph.
In our example, we see readers spend quite a bit of time on the title page. Pages 2-3 contain a moderate amount of text, and most readers seem to read them less. Although pages 4-5 have similar content, they get more attention. Pages 8-11, however, despite having the same amount of text, are more engaging due to the addition of audio and video hotspots.
NOTE❕The average time spent can vary based on the page's content. For example, if the first page is a brief introduction, readers might only spend a few seconds reading it, whereas they could spend more time on detailed product descriptions on the next pages.
Hotspots
In this tab, you can see the total number of clicks on interactive hotspots in your flipbook presented in table form in the selected period. A hotspot can be a link, a photo gallery, a video, an audio file, a GIF, or a product tag.
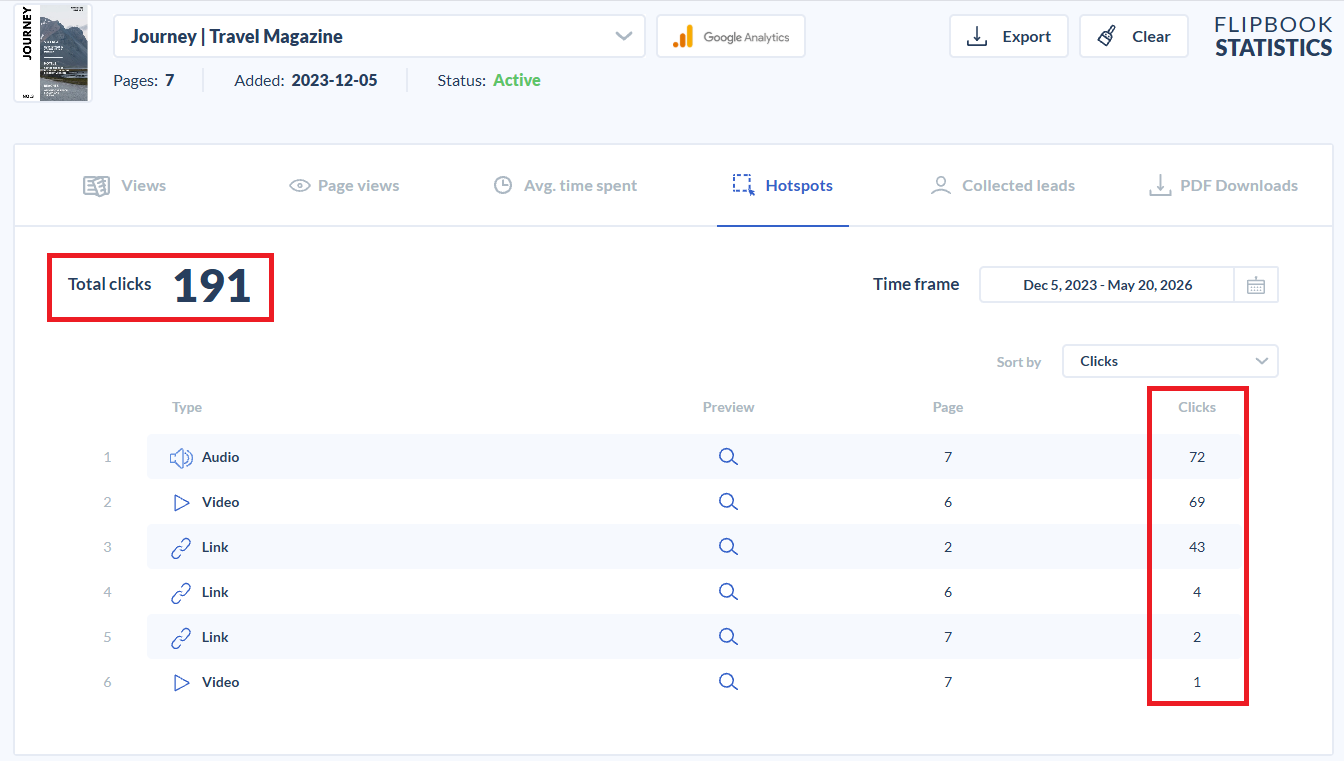
The table shows:
- Type - The type of hotspot
- Preview - Opens the hotspot in a pop-up after clicking on the magnifying glass icon
- Page - The page where it was clicked
- Clicks - The total clicks a hotspot received
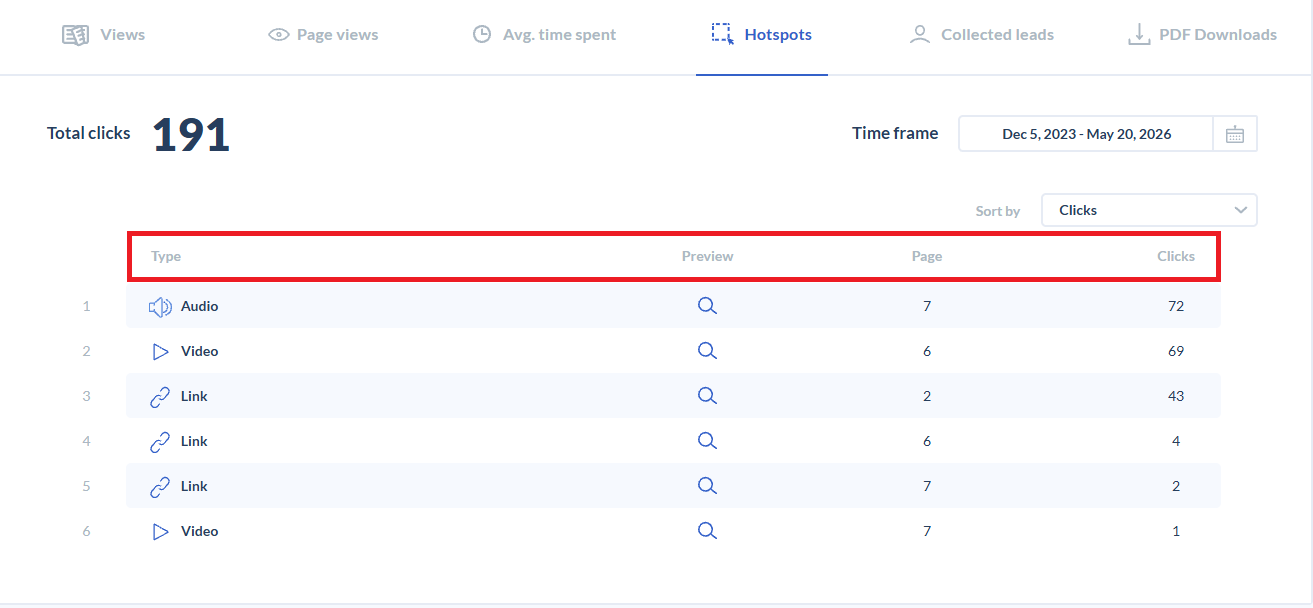
In our example, the audio hotspot on page 7 was clicked 72 times, and the video hotspot on page 6, 69 times, between December 5th, 2023, and May 20th , 2026.
Additionally, you can sort the table by total clicks, page, or hotspot type. Just press on the drop-down menu in the top right corner to see these options.
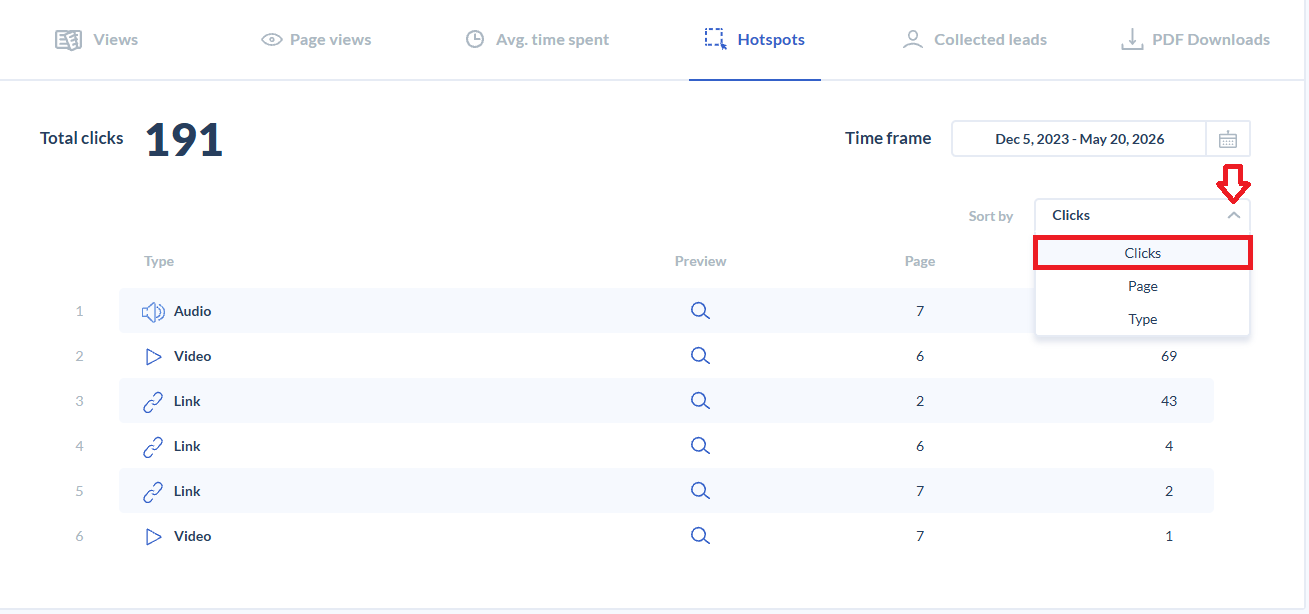
The Hotspots tab lets you track and analyze which interactive elements get the most attention from your readers, allowing you to adjust your content.
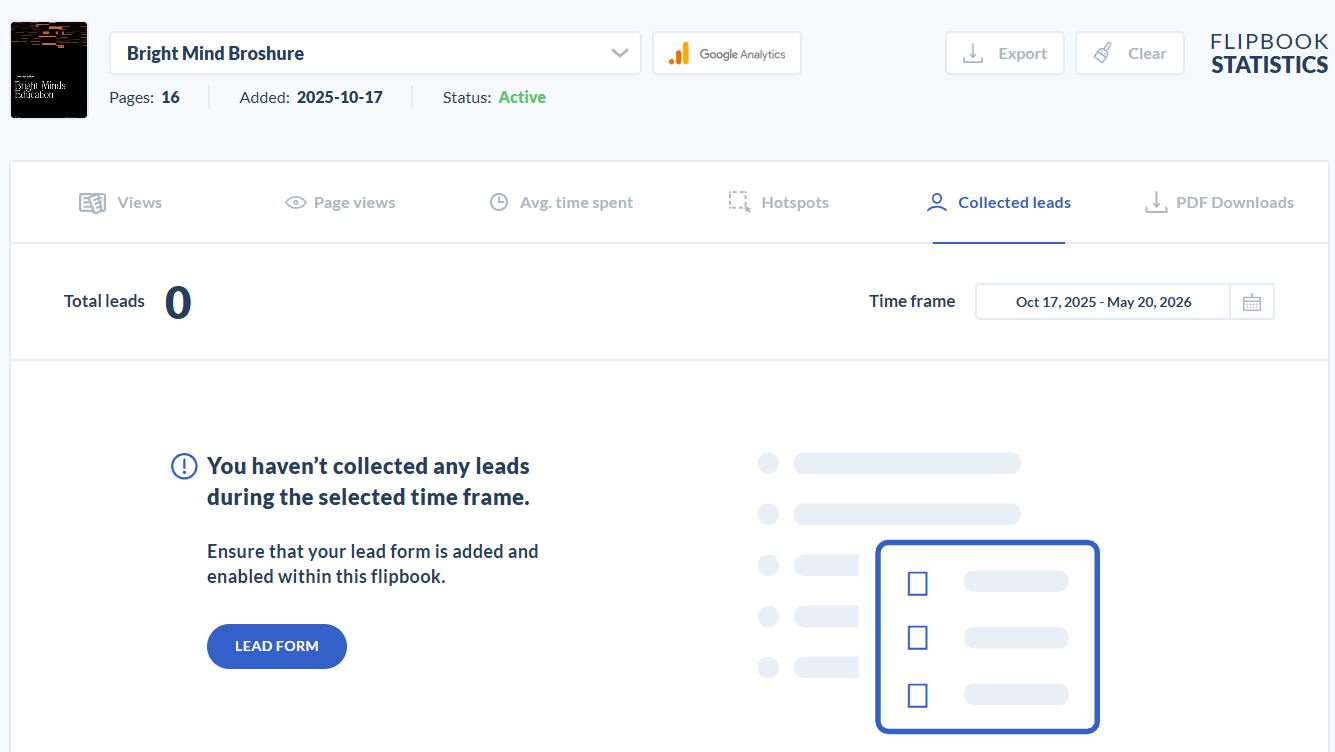
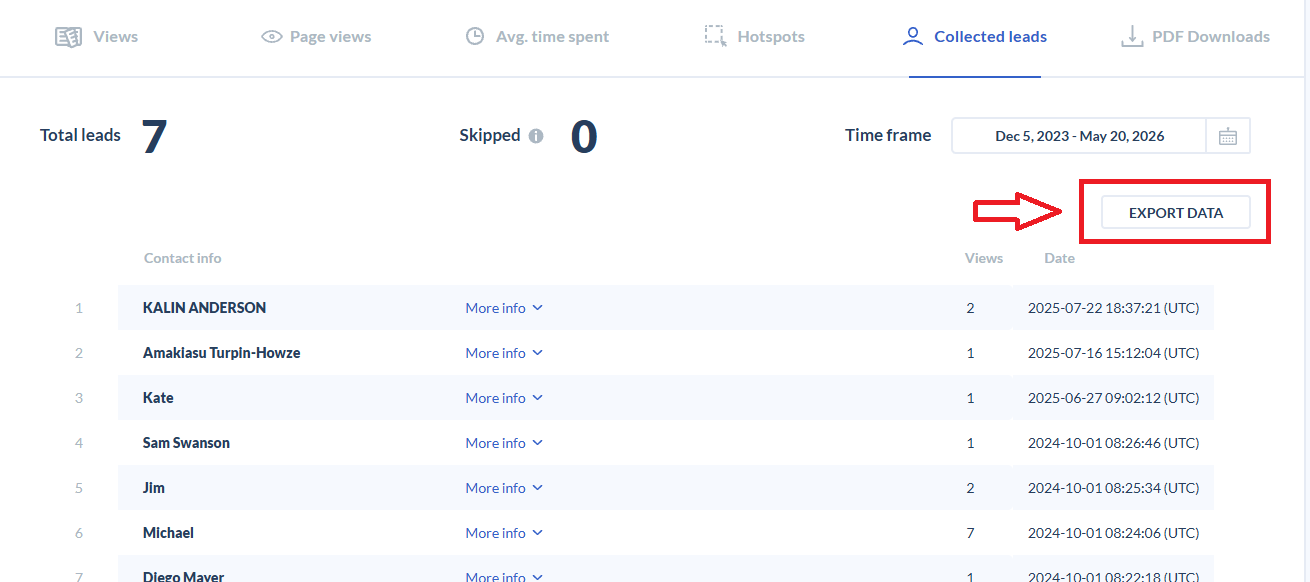
Collected leads
Publuu's Optimum and higher plans allow you to create a lead form to capture reader information, such as name, email, and other details. If you've added the lead form to your flipbook, this panel will display the leads collected during the specified period.
At the top, you'll see:
- Total leads - Number of readers who fill out the lead form
- Skipped - Number of times your readers skipped your lead form without providing their details
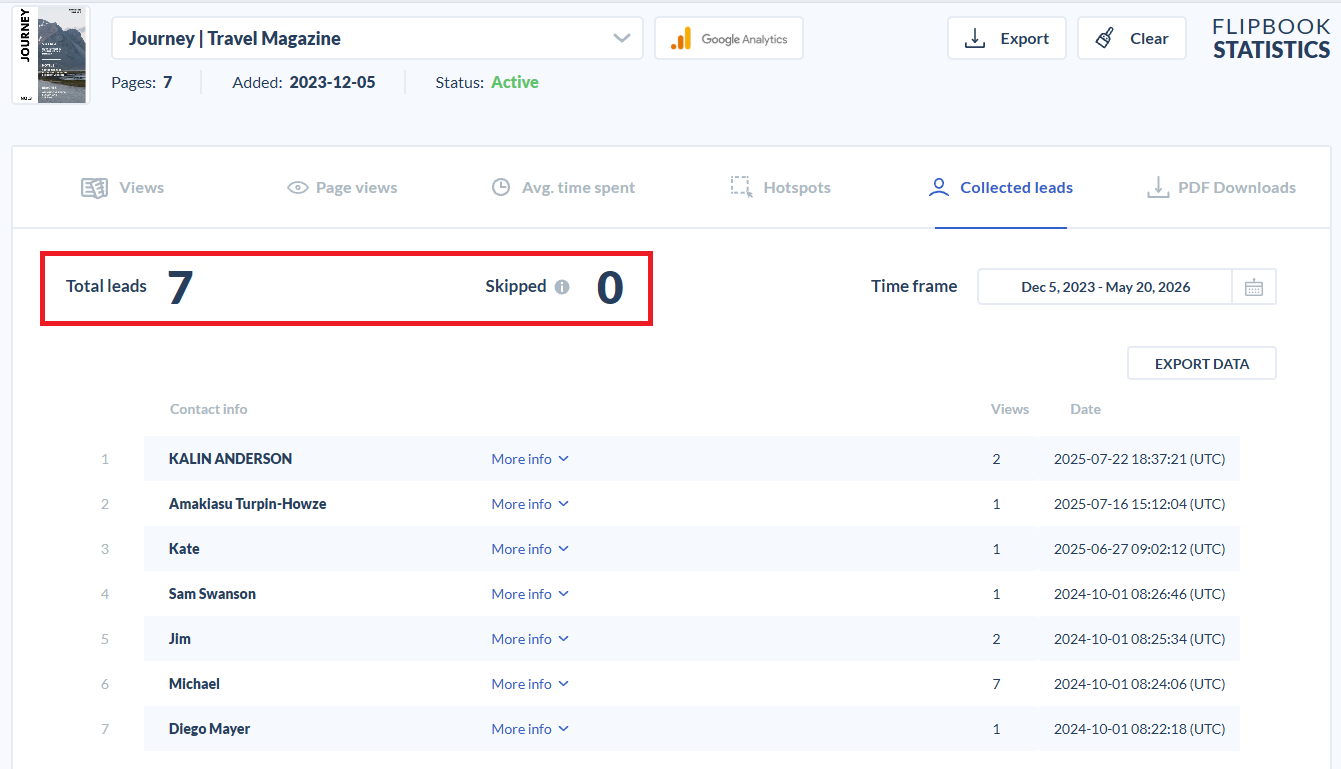
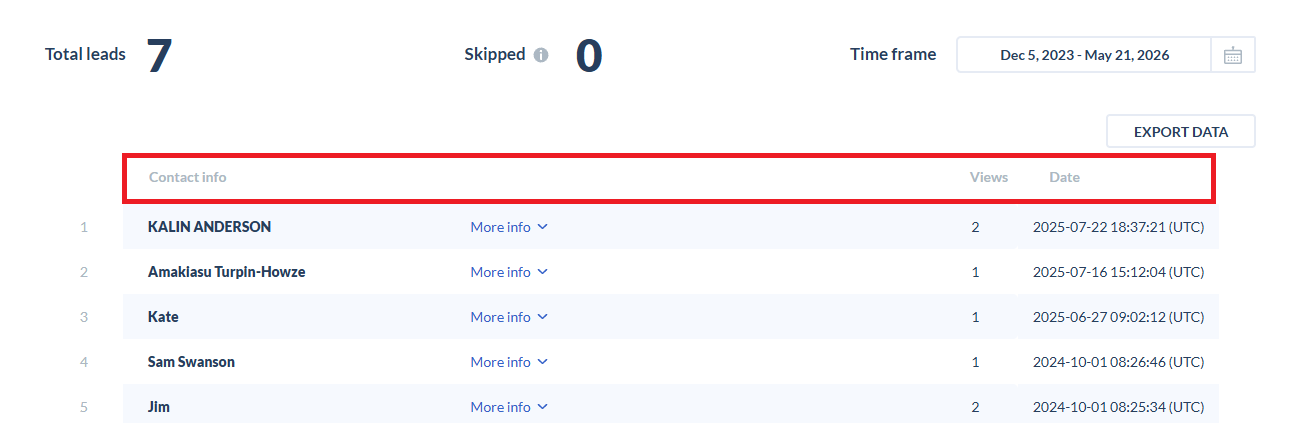
This panel enables you to check:
- Contact info - Details submitted by your readers, such as name and email
- Views - Number of times each lead opened the flipbook
- Date - Date when a lead was collected
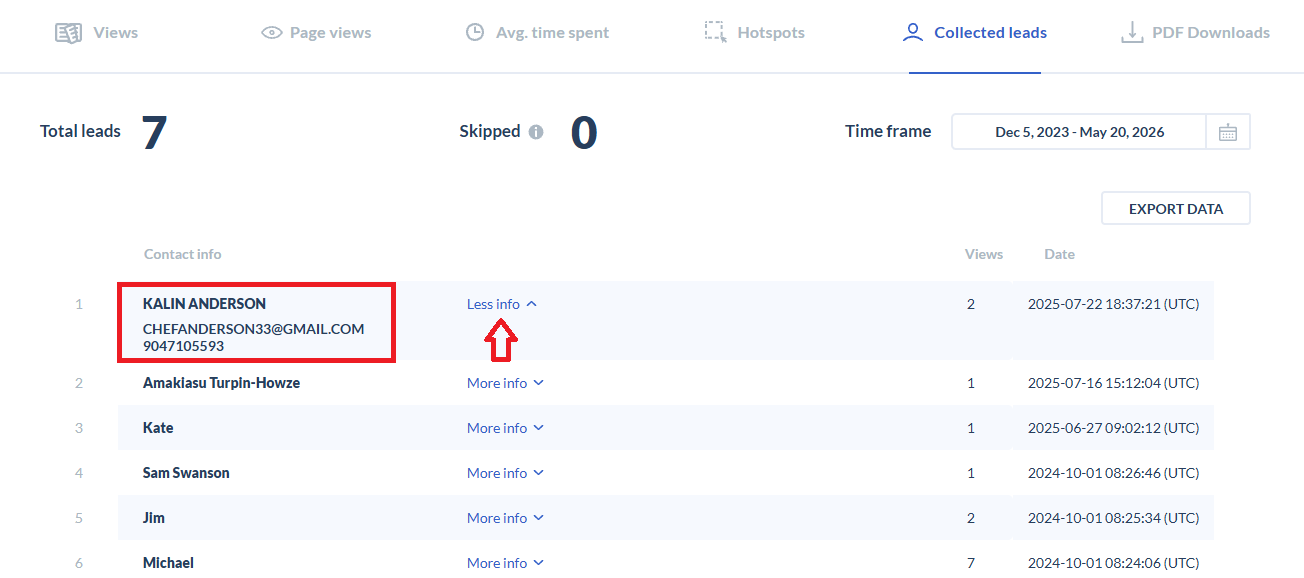
In the contact info, you can view the lead's name, and by clicking "More info" you can access additional details like email and other submitted information, or hide them by clicking "Less info".
Notice that these statistics appear only when a lead form is created and filled out; otherwise, you'll see the following message on your screen:
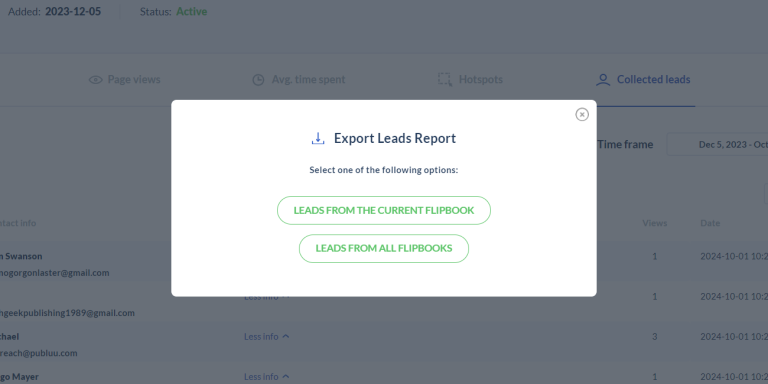
Publuu also lets you export leads data directly from the statistics panel with just one click:
and allows you to choose whether to export leads from the current flipbook or all flipbooks.
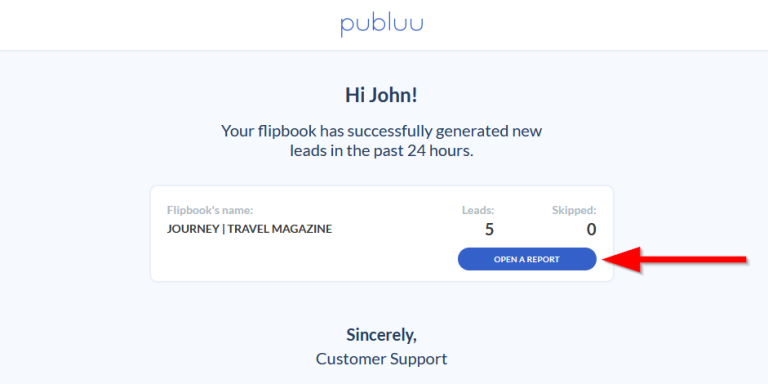
Additionally, if your flipbook collects any leads, you will receive "Your daily lead report" email with the number of new leads from the past 24 hours. You can open the detailed report directly from the email.
PDF Downloads
In this section, you can view the number of PDF downloads. As with Views, the system automatically suggests grouping, and you can choose from the list to view by day, week, month, or year.
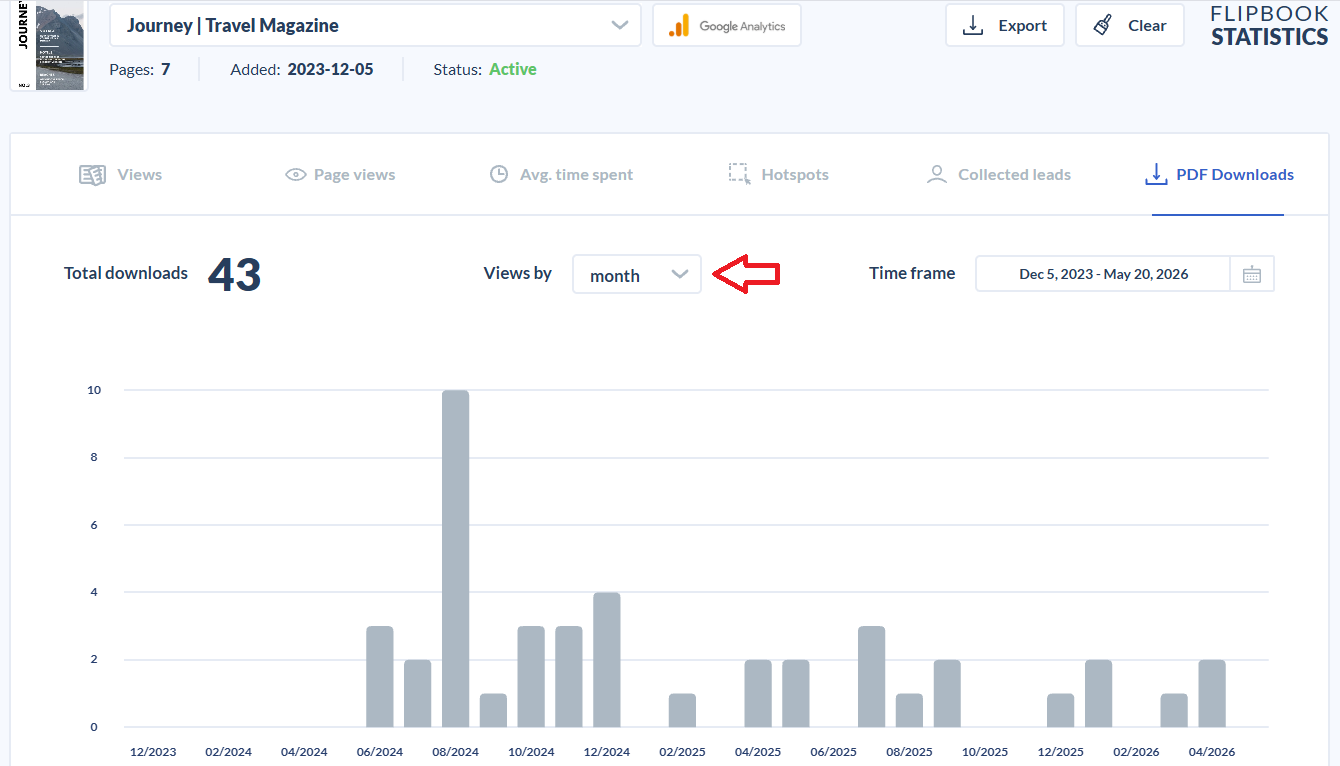
If there were no downloads, you'll see the message:
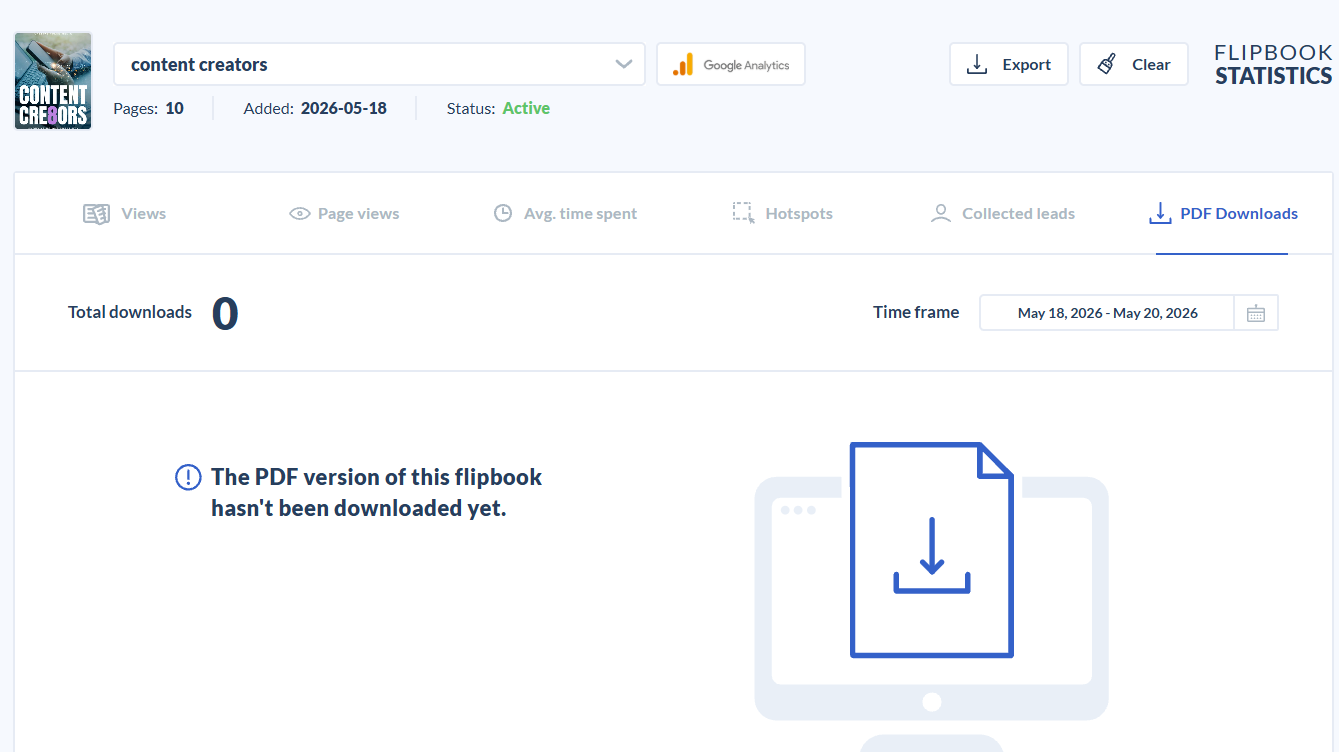
NOTE❕This message also appears if the "PDF download" feature is disabled.
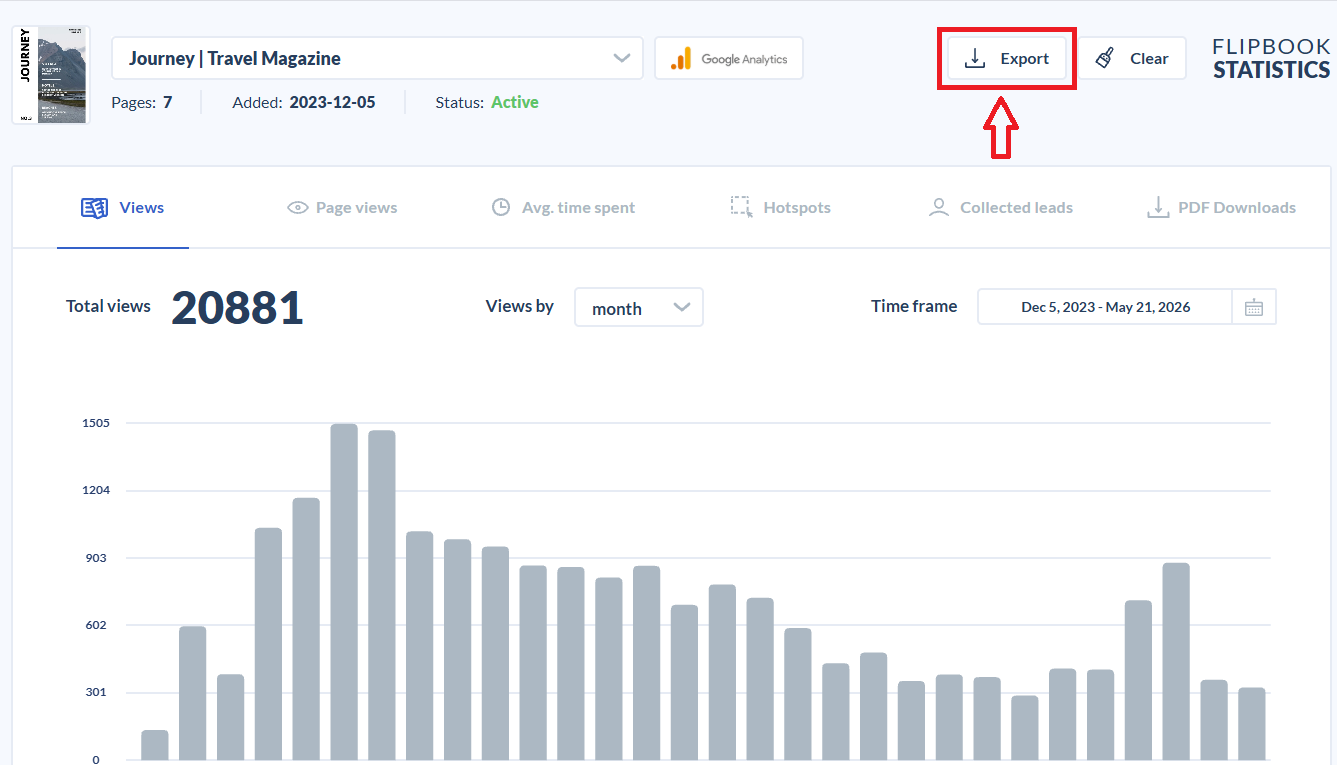
Export statistics
Publuu allows you to export your analytics data as an Excel file. To do this, simply click the Export button at the top of the statistics panel.
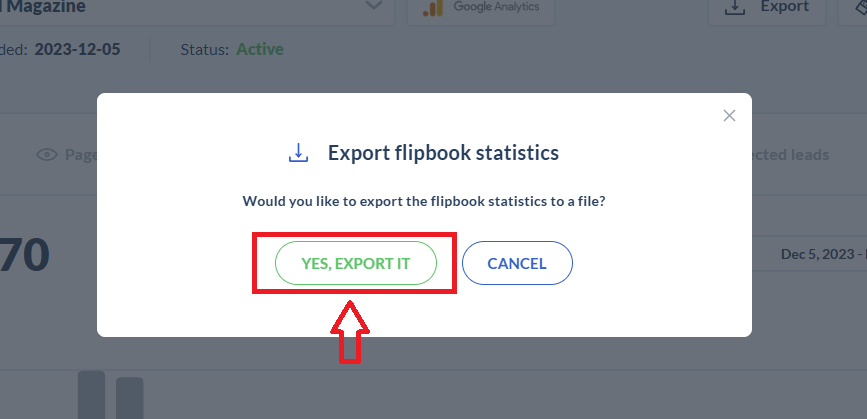
In the pop-up window that appears, confirm by selecting "Yes, export it".
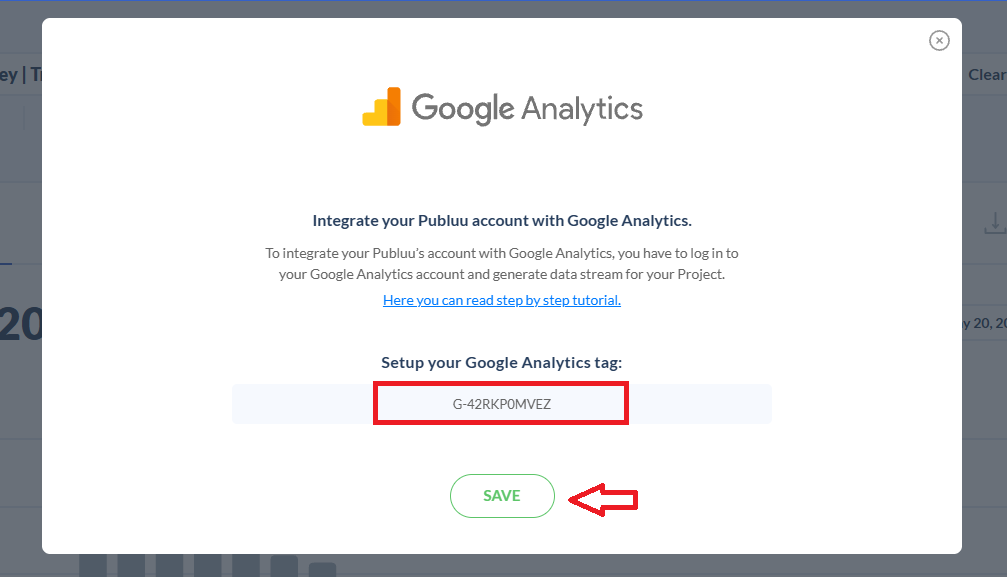
Google Analytics integration
For more detailed insights, you can integrate your account with Google Analytics.
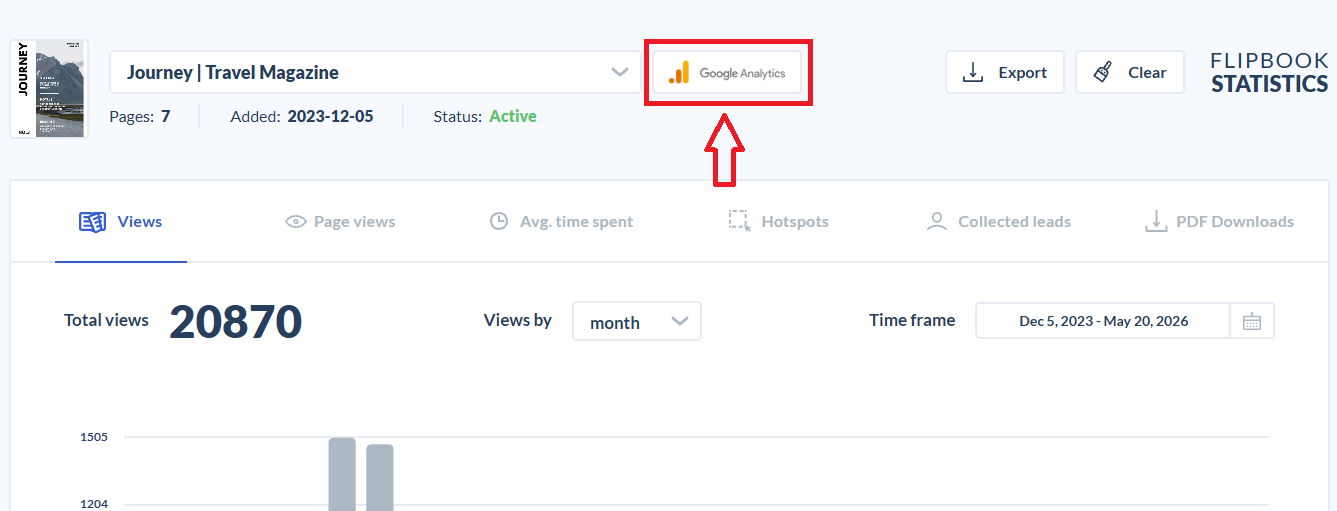
To set this up, first log in to your Google Analytics account, create a Google Tag, and copy it.
💡TIP: If you don’t have a Google Analytics account yet, follow this guide before moving further.
Once you have the tag, click the Google Analytics button in the statistics panel and paste the tag into the provided field and press Save.
For detailed instructions on Google Analytics integration, please check out this guide: How to integrate your account with Google Analytics?
You may be also interested in:
Flipbooks on mobile devices
How to set the expiration date for my flipbook’s link?