What is a management report: types, tools and examples
In a contemporary company, managers must stay informed about the business's operations. If you're a CEO, you need to be fully aware of any potential threats and risks. Therefore, your employees need to keep you updated on any relevant news. Whether they're creating a paper document or a presentation online, employees need to learn how to prepare effective management reports.

In this text, we'll explain what a management report is, why you should create one in your company, what tools to use in management reporting, and much more! Read on to learn about the best practices for creating reports and how to fully use these documents in your industry.
Key points
- A management report is a document that helps decision-makers understand a company's performance by analyzing various aspects of the business.
- It helps management run the company effectively and make informed decisions.
- When creating a management report, set goals and relevant KPIs, and take care to visualize the data - preferably presenting it as a HTML5 flipbook.
- The report should include an executive summary for management, a statement of purpose, an overview of relevant data, an action plan and recommendations.
What is a management report?
A management report is a document that helps decision-makers or CEOs in a company understand how well the business is performing. This report analyzes various aspects of the enterprise to assess its overall performance. It gathers complex business information from many departments and presents it clearly to assist the company's leaders in making informed decisions.
This type of report collects various information from across the company, for example, from the sales, finance, and production departments, to give readers a comprehensive view. It must be based on actual data, such as KPIs (Key Performance Indicators), which indicate how well different parts of the company are performing.
However, instead of long lists of numbers, management reports often use charts, graphs, and infographics to make the information easier to interpret and understand quickly.
What is the main purpose of management reports?
The main purpose of these reports is to help management run the company effectively, often by making crucial decisions at the right time. As a result, they often contain financial reports detailing the company's earnings, expenditures, and savings. This helps ensure the company remains financially sound.
Management reports are usually prepared regularly - monthly or every few months - to keep stakeholders informed and updated on the company’s progress.

Key benefits of effective management reporting
Management reporting is a very important feature of a company. Here are some major benefits of preparing these reports regularly in your company:
-
Access to key information: Management reports provide up-to-date information about the company, gathering the most important details in one place so it's easy to understand.
-
Improved decision-making: Thanks to clear and organized information, decision-makers can act more quickly and make better-informed choices. Publuu flipbooks allow you to display data in a clean and efficient way to maximize the effectiveness of your reports.
-
Identification of key issues: Reports highlight crucial pain points and show the sections within the company that need immediate attention.
-
Group cooperation: Departments use management reports to inform the board about problems related to these specific areas. This simplification helps create a top-down view of company-wide issues.
-
Spotting problems: Regularly reviewing reports can help identify potential problems or emerging opportunities and avoid real disasters.
Types of managements reports
Analytical reports
These reports provide detailed analysis of the company's strategies and actual performance. They should rely on tangible data, like sales figures, to show what is really happening in the company. This allows managers to understand the efficiency of the company's operations and make better strategic decisions.
Internal reports
Internal reports analyze the performance of a group or department based on success rates and internal business intelligence. They focus on activities within the company, highlighting what is going well and what may need attention. This helps managers understand whether employees are working effectively.
Operational reports
Operational reports examine the daily functions of the business to ensure everything runs like smoothly. They are typically written every month, quarter, or year and summarize all activities and performance from this period. They allow managers to understand the entire operational process and fine-tune it to meet the company's needs.
💡Related topic: How to write a project report
How to create a management report
1. Set your goals
Decide what strategic goals you want to achieve with your report. Should your report represent achievements or monitor progress accurately? Do you want to create operational reports or financial management reports?
Choose the key performance indicators (KPIs) that the report will represent. For example, if you want to describe what is happening in the sales department, focus on factors like the number of deals made, profit, deal time, etc.
2. Gather the information
Gather all the important data you need. Collate data from sales and other departments, using tools like CMS that show results. You'll need tools that help you gather information from different parts of the company and coordinate everything to create one consistent report.
3. Plan your report
Think about what your bosses need to know most, and then decide how to organize the information. It's worth choosing a template at this point to save the report in an easy-to-read flipbook format from Publuu.
Your report should include:
-
Key objectives for the report (its aim and reason for creation).
-
How key indicators have changed over time and what that means.
-
Current performance data.
-
A brief summary of the company's performance.
-
A summary of the company's financial situation.
-
Suggestions and potential solutions.
4. Make it easy to understand
Tell the story with your data - don’t limit yourself to just presenting raw numbers. You need to place them in context and present them in a way that draws conclusions. Try to use storytelling techniques to explain the company’s recent history and analyze cause-and-effect relationships.
Use interactive flipbooks to make your information clear and transparent. With Publuu, you can easily turn any PDF into a professional digital publication that’s simple to browse.
Publuu’s online flipbook example
Share your report with managers by sending a link to your flipbook or presenting it at a meeting. Publuu lets you easily share the report and showcase your content using HTML5 compatible display, so you can use any phone, tablet or computer to display your documents.
When presenting the report, focus on data, not emotions, and guide your bosses to use the information for informed decision-making. Showing KPIs and recommendation needs to be objective and to the point - avoid overwhelming your audience with unnecessary details. Keep the presentation clear, focused, and aligned with the goals of the report.
Management report vs. financial reports
While a management report may include some financial data, financial reporting is not the same as management reporting. There are differences in the target audience and style, making these types of reporting distinct.
Target readers
Financial reports are often aimed at people outside the company, like investors or government regulators.
Management reports, as the name implies, are addressed to company leadership to help them make informed decisions.
Are they mandatory
Financial reports are required by law in many places. In a stock-owned companies, they need to be prepared and sent to stockholders and government agencies responsible for regulating the stock market, such as the SEC in the U.S.
Management reports are optional. They are used internally within the organization and are typically not meant to be distributed to outsiders.
How they're written
Financial reports must follow strict rules about what to include and how to write them. There are often government-mandated forms and templates.
Management reports can be written in whatever format the company finds most useful. They're more flexible and are supposed to be accessible by the managers.
What they cover
Financial reporting covers the overall performance of the company, especially the balance and assets of the enterprise.
Management reports often focus on specific areas of the company, especially in case of errors or issues that need addressing, so management can diagnose problems and plan for the future.
💡Want to know more? Read about financial planning in our Knowledge Base!
Tools for management reports
Understanding your report and data is easier when you can see or perceive it in a visual way. Below, we list several computer management reporting software that can help you gather relevant information and show it in an effective way:
1. Publuu
![]()
Publuu is a good tool for data visualization and analysis. If you prepare your report in PDF format, you can easily convert it into an online flipbook that can be opened in any web browser without any external app. You can convert any text raport into an interactive presentation, adding animations and hotspots, taking your management report to the next level.
2. Zoho Analytics
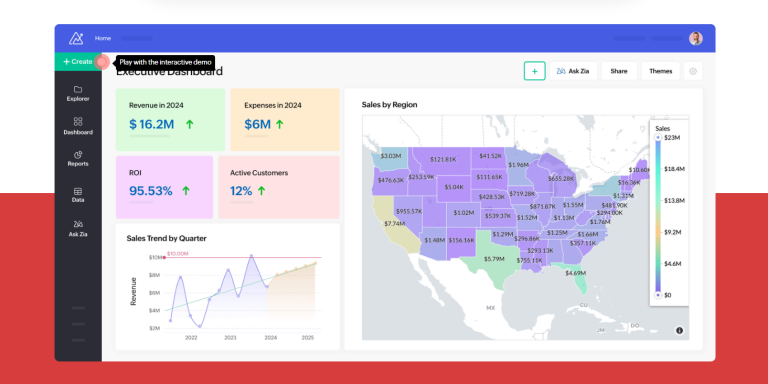
Zoho Analytics is a software program that helps people create charts based on analytical data. It is a useful tool for creating reports because it can take information from various departments in a company and put it into one single report. The entire Zoho suite is helpful in managing projects, allowing you to monitor progress and collaborate with others.
3. Asana

Asana is a project management tool that helps track tasks and projects with easy-to-use visual tools. It allows you to set goals to ensure your daily work aligns with your overall plans. With integrated Universal Reporting functionality, it shows teams how their tasks are progressing and whether the project is running properly. In your report, you can use the data collected in Asana to make your reports easy to understand.
4. Hive

Hive offers multiple ways to display information for different types of project management. With Hive, you can set goals, view graphs related to your work, and track how much time people are spending on tasks. It's also a good tool for creating reports, as you can customize the appearance of reports, view your work in various formats, and easily manage projects and tasks.
5. ProWorkflow

ProWorkflow is a project management software that also helps you create reports. It is easy to use because it offers a simple and intuitive interface. ProWorkflow is really good at creating visualizations of information, such as charts and graphs. It also helps you quickly generate price estimates, invoices, and other types of reports.
Best practices in management reporting
Define clear objectives
Start by defining the purpose of the report and who the target audience is. Clearly state the objective, for example: This report summarizes the results of sales and distribution of power tools in the CEE region in the fourth quarter of 2020. Explain how the report will help the company achieve its goals. Based on your data analysis, present possible scenarios, but let readers come to their own conclusions.
Choose the right measurements (KPIs)
Choose key numbers that show how well the company is performing or highlight the main issues. In the sales and distribution example, this could include sales volume, storage levels, sales per capita, time to delivery, cost of storage, and other relevant data. Be sure to include measurements that directly relate to the report’s focus.
Tell a clear story
Consider what your bosses need to do with the information. Think about causes and effect - are sales too low, or is the process too slow? Base your analysis and answers on hard data. You can use storytelling for this purpose, telling the story of development and changes within departments. Be concise and to the point, keeping the report formal but in understandable language.
Use visual aids
Today, business leaders often need to make quick decisions based on just a glance. Include charts and graphs to make the information easier to understand at the first sight. Use colors and patterns to highlight key information and underline important issues visually. Publuu allows you to enhance your reports by adding interactive elements like hotspots for easy navigation within PDFs and HTML5 documents.

Create recommendations
Don't just present data; suggest what to do next. Give potential solutions and ideas for action based on what the report shows. In your report presentation, you can also offer possible interpretations - sometimes the next steps will be clear, like increasing supply or lowering prices. However, it is often useful to present more options so the leaders can make the right decisions.
Balance the information
Don't overwhelm the reader with too much data. You often have access to specialized information that your audience may not fully understand, so try to simplify and reduce difficult data. Try to make each report contain 3-6 main points.
Tailor the report to its audience - different managers may need different information. For example, if the report is focused on the HR department, you likely won’t need to include sales data.
Examples of successful management reports
Start by giving your report a name or title that's easy to identify, and point out the target audience and the author.
Report for Recruitment Procedure
- Report to: Chief Executive Martin Bosco
- Report By: HR Senior executive Arthur King
- Subject: New Recruitment Drive
💡 NOTE: The first page of your report should contain an executive summary so that the reader can learn the key points at a glance.
Purpose of Report
Describe and analyze the preparation for the large-scale recruitment for the new assembly plant in Amala, to provide new workforce members and transfer experienced employees.
💡 NOTE: Try to summarize the goal of the report in one or two sentences to make it easy to understand.
Recommendations:
-
Due to higher demand, management should increase the operational budget for recruitment and advertising.
-
Assign at least three administrative workers to the Amala office to help with the increased recruitment efforts.
-
Work on recruitment campaign and marketing strategy aimed at potential workers.
💡 NOTE: These are the key points you can showcase - alternatively, you can mention that recruitment is intended to support expansion.
In the proper reporting process, start with an overview of how the new factory is about to open and how the HR department is handling the recruitment of new workers. You should cover points like budget, recruitment results, and ongoing training of new hires.
Include a factor analysis and objectives. Don’t forget to evaluate potential challenges.
End the management report with an action plan and recommendations, possibly using a SWOT analysis based on the data you have included in the report. This will provide a structured way to evaluate the strengths, weaknesses, opportunities, and threats of the recruitment process.
FAQs
Why are management reports important?
Management reports provide business leaders with accessible information about a company's financial health, help identify areas of concern, and support informed decisions about strategy and operations.
By analyzing trends and patterns in data, management reports can help forecast future performance, including cash flow, sales forecasts, and market share.
What should successful management report include?
Management reports contain data from various departments and units within a company. They should include: key performance indicators (KPIs), financial data and analysis, information to facilitate decision-making, and data-driven insights for business evaluation.
Who writes management reports?
This is usually a joint effort including:
-
Controllers and accountants within the company
-
CFOs or vice presidents of finance - in smaller companies, this is typically the person responsible for finance
-
Accounting and finance staff
-
In-house legal counsel
-
Middle management to coordinate work
-
Large companies also often use specialized auditors and other third parties.
How often should management reports be generated?
The frequency depends on the organization's needs, size, industry, and goals. Typically, they are prepared monthly, quarterly, or annually. Regardless of the company's situation, regular and timely preparation of reports is key.
Conclusion
Management reports are essential for keeping business leaders informed and enabling them to make smart, data-driven decisions. By using clear objectives, relevant KPIs, and visual tools like charts and graphs, these reports provide a concise view of a company’s performance, helping identify challenges and opportunities.
Well-prepared reports don’t just present data - they offer actionable insights that guide strategic decisions. With the right approach and tools, management reports become powerful assets that drive efficiency, improve operations, and support growth.
You may be also interested in:
Marketing Plan – the Complete Guide